
5
BASIC GRAPHS
THE FOLLOWING ARE THE GRAPHS that occur throughout analytic geometry and calculus. The student should be able to recognize them -- and sketch them -- purely from their shape. It is not necessary to plot points.
A constant function
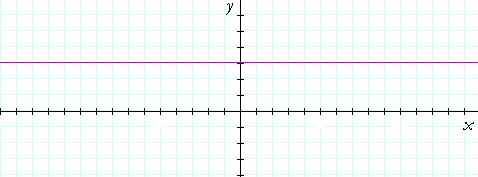
Here is the graph of y = f(x) = 3. It is a straight line parallel to the x-axis. It is called a constant function, because to every value of x there corresponds the same value of y: 3.
Is a constant function single-valued? Yes, it is, because to each value of x there is one and only one value of y. 3.
A constant function has the form
y = c ,
where c is a constant, that is, a number.
The identity function and the absolute value function
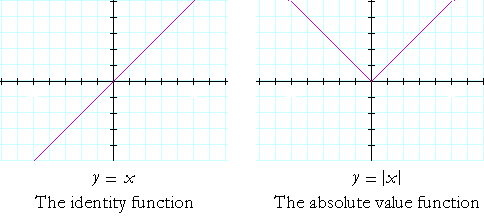
y = x is called the identity function, because the value of y is identical with that of x. The coördinate pairs are (x, x).
In the absolute value function, the negative values of y in the identity function are reflected into the positive side. For, |−x| = |x| = x. The coördinate pairs are (x, |x|).
Example.
a) What is the domain of the identity function?
There is no natural restriction on the values of x. Therefore, the domain -- where the function "lives" -- includes every real number.
−![]() < x <
< x < ![]()
Note first that infinity "![]() " is not a number nor is it a place. It is a manner of speaking. We mean, "x could take any value however far to the right on the number line (x <
" is not a number nor is it a place. It is a manner of speaking. We mean, "x could take any value however far to the right on the number line (x < ![]() ), or however far to the left
), or however far to the left
(−![]() < x)."
< x)."
Note also that we write "x less than ![]() ." Equal to infinity makes no sense.
." Equal to infinity makes no sense.
b) What is the range of the identity function?
The range are those values of y that correspond to the values in the domain. Inspecting the graph will show that y, also, will take every real value.
−![]() < y <
< y < ![]()
Parabola and square root function
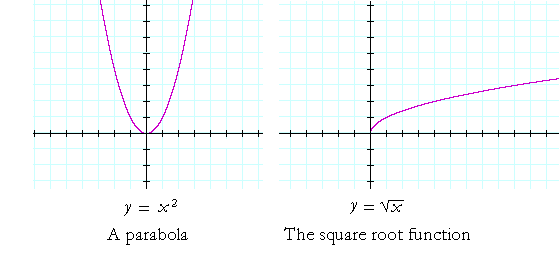
In the parabola y = x², the coördinate pairs are (x, x²). We can see that the following points are on the graph: (1, 1), (−1, 1), (2, 4), (−2, 4), and so on.
The graph of the square root function is related to y = x². It is its inverse. The coördinate pairs are (x, ![]() ). For example, (1, 1), (4, 2), (9, 3), and so on.
). For example, (1, 1), (4, 2), (9, 3), and so on.
Notice that the square root function is defined only for non-negative values of x. For, the square root of a negative number is not real.
Problem 1. What is the domain of the function y =x², and what is its range?
This function is defined for all values of x : −∞ < x < ∞.
As for the range, the lowest value of y is 0. And there is no limit to the highest value. 0 ≤ y ∞.
Problem 2. What is the domain of the square root function, and what is its range?
As we have stated, the square root function is defined only for non-negative values of x. Domain : x ≥ 0.
As for the range, the lowest value of y is 0. And there is no limit to the highest value. 0 ≤ y < ∞.
(If you are not viewing this page with Internet Explorer 6, then your browser may not be able to display the symbol ≤, "is less than or equal to;" or ≥, "is greater than or equal to.")
The cubic function
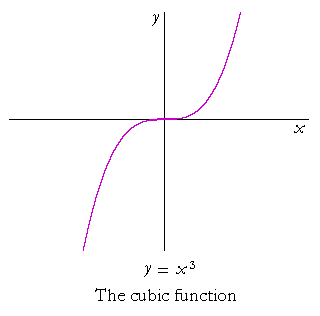
The cubic function is y = x³. When x is negative, y is negative -- odd powers of a negative number are negative.
Problem 3. What is the domain of the cubic function, and what is its range?
Domain: −∞ < x < ∞.
Range: −∞ < y < ∞.
Next Topic: The vocabulary of polynomial functions
www.proyectosalonhogar.com