Section 3: The graph of y = A quadratic
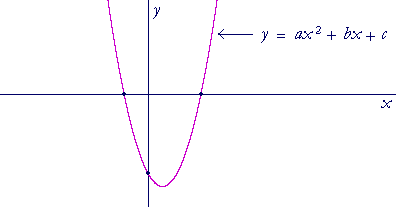
THE GRAPH OF EVERY QUADRATIC is the figure known as a parabola.
Question. What is the relationship between the roots of a quadratic and the x-intercepts of its graph?
To see the answer, pass your mouse over the colored area.
To cover the answer again, click "Refresh" ("Reload").
Do the problem yourself first!
The roots are the x-intercepts! They are the values of x that make the quadratic equal to 0. y = 0. They are the solutions to the quadratic equation.
The y-intercept of the graph is the constant term c. It is the value of y when x = 0.
Example 1. Here is the graph of y = x² − 2x − 15.
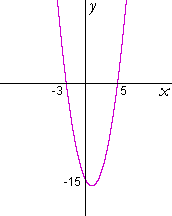
x² − 2x − 15 = (x + 3)(x − 5)
The roots -- the x-intercepts -- are −3 and 5.
The y-intercept is the constant term, −15.
For the graph of a parabola that begins −x², see Topic 15 of Precalculus: Reflections about the x-axis.
Example 2. A quadratic inequality. For which values of x is
x² − 2x − 15 < 0 ?
Solution. This is the quadratic of Example 1. Look at its graph. Where is it negative -- below the x-axis?
It's negative between the roots. That is, that quadratic is negative -- less than 0 -- when x is between −3 and 5: when −3 < x < 5.
(See Lesson 11 on inequalities for the meaning of that continued inequality.)
Similarly, we could ask for which values of x is
x² − 2x − 15 > 0 ?
Look at the graph. That quadratic is positive -- the graph is above the x-axis -- when x < −3 or x > 5.
We have now covered the three possibilities:
That quadratic is equal to 0 at the two roots.
It is less than 0 between the two roots.
It is greater than 0 to the left and right of the two roots.
These three possiblities, which are true for any real number, has the fancy name of the Law of Trichotomy. Any number must be either equal to, less than, or greater than 0.
Example 3.
How many real roots, i.e. roots that are real numbers, has the quadratic of each graph?
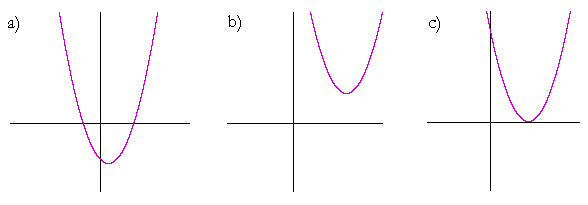
Answer. Graph a) has two real roots. It has two x-intercepts.
Graph b) has no real roots. It has no x-intercepts. Both roots are complex.
Graph c) has two real roots. But they are a double root. The graph touches but does not cross the x-axis.
In which graph is the discriminant positive? Graph a).
In which graph is the discriminant negative? Graph b).
In which graph is the discriminant 0? Graph c).
Problem 1. Sketch the graph of y = x² − 2x − 8. That is, show the x- and y-intercepts.
x² −2x − 8 = (x + 2)(x − 4).
The roots are −2, 4. The y-intercept is the constant term, − 8.
Problem 2.
a) Solve this quadratic inequality:
x² − 2x − 8 > 0.
This is the quadratic of Problem 1. The graph is positive when x < − 2 or x > 4.
b) Solve x² − 2x − 8 < 0.
The graph is negative when −2 < x < 4..
Problem 3. Sketch the graph of y = x² + 4x + 4.
x² + 4x + 4 = (x + 2)². There is a double root at −2. The y-intercept is the constant term, 4.
Problem 4. Sketch the graph of y = x² + 3x.
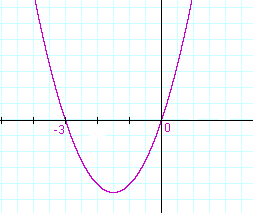
x² + 3x = x(x + 3). Therefore, the roots are 0, −3.
Since the constant term is 0, this graph passes through the origin.
Problem 5. Sketch the graph of y = 3x² − 5x − 2.
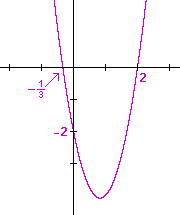
3x² − 5x − 2 = (3x + 1)(x − 2). The roots are −1/3, 2. The constant term is −2.
Please make a donation to keep TheMathPage online.
Even $1 will help.
Copyright © 2001-2007 Lawrence Spector
Questions or comments?
E-mail: themathpage@nyc.rr.com